Infinite Scroll Memory Optimization
In my previous post, I talked about my Pinterest-like interface for Encyclopedia of Life (eol.org). In this post I’m going to go through my iterations to optimize the memory usage of my web app.
A Problem With Infinite Scroll
After the first iteration, I started using my interface for browsing EOL and started collecting my favourite pictures. However, after about 7500+ images later Chrome ran out of memory. It’s a known issue with infinite scrolling lists that memory is an issue on top of the task of making it all scroll smoothly. I dealt with that recently on Windows Phone and iOS. Now that I know I can easily hit the memory limit during normal browsing, I have to fix it up.
Browsing the web I found that LinkedIn recently added a post on the techniques they used. My techniques however are a bit different, but both my and LinkedIn’s approaches should help.
Iteration 1:
My initial version simply did the very naive thing, which is to continuously add <div> elements to the page. When I monitored the number of DOM nodes using this approach, I got the following graph using Chrome Developer Tool:
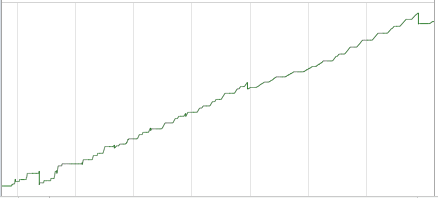
Memory usage after 2500 images: 48.87MB
DOM Node Count: [1611-23403]
As you can see, it’s ever increasing so of course I eventually ran out of memory.
Iteration 2:
I knew from mobile development of how to implement infinite scroll on mobile devices, so the first approach I tried was to limit the number of cells (aka <div> elements) on the page. I did this via knockout.js by having a separate observableArray from my actual data. At any time I only put a bit more than a screen worth of cells in the observableArray. This means that there is only ever that many <div> elements in the DOM at any one time. Every time I swap in new content, the old <div> elements are removed and replaced with new ones.
My approach differs from LinkedIn’s approach because the elements on my page are position:absolute; and I didn’t need to insert stubs at all. Regions which you don’t see content are really just empty with nothing there.
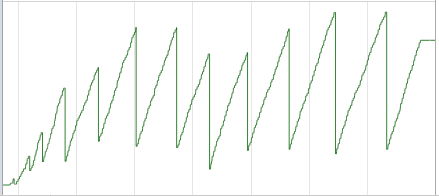
The node count graph became this:

Memory usage after 2500 images: 20.19MB
DOM Node Count: [524-19933]
Wow! That’s half of the memory usage compared to the naive version. Also, you can see that the graph is sawtooth-like showing when Chrome garbage collected the <div> elements and images I threw out.
Iteration 3:
Feeling encouraged and in the right direction, I started doing the real work of reusing cells. I did this first to the cells showing loading images as a small test. Instead of removing <div> elements and adding new ones, I modified my data’s left and top position variables to be knockout observables. This means that when I change them, the <div> element’s position on the page will change as well without actually removing and adding back the element.
I got this afterwards:
Memory usage after 2500 images: 20.22MB
DOM Node Count: [540-24478]
There’s a slight increase in memory usage from this approach, and at the time I figured that was just because there are so few cells showing loading image that it didn’t matter, so that brings me to iteration 4.
Iteration 4:
I applied the same approach as iteration 3 to all cells showing actual EOL images. The timeline graph looks a lot better with # of DOM node count much lower:

Memory usage after 2500 images: 26.46MB
DOM Node Count: [518-571]
At this point I was shocked. The approach which I thought would bring memory usage down actually increased it. I measured it couple more times to make sure and the results were the same.
At this point I’m disappointed but a bit excited too because I know that I’m just about to learn something.
Iteration 5:
I used Chrome’s Heap Profiler tool to analyze what happened between iteration 2 & 4. I noticed that the js Array containing EOL image data is larger in iteration 4 than iteration 2. Drilling deeper, I found that each object in iteration 4 takes up more memory than iteration 2. Check out the screenshot comparison to see the size of “smallImage” field:
 vs
vs 
In iteration 2, smallImage field simply stored the URL of the EOL image and took up 88 bytes. However, in iteration 4 the same field now takes up 592 bytes.
As you will see in the screenshot that the increase is due to usage of knockout.js observable which is a more complex js object than a simple string. What this means is that I’ve reached the limit of how much there is to optimize in terms of display side of things. After realizing this I removed observables where I didn’t actually need them and the memory usage after 2500 images went all the way down to 6.78MB.
The iterations up to this point aimed at optimizing the memory usage consumed by visual elements. The real solution to have really infinitely scrolling UI is to also do the same to the underlying data, which in my case is the js Array containing EOL image URLs and names. The proper way is to toss out data that are not in view and reload them if the user scrolls back up or bring them back into view. That’s exercise for another day if I run out of memory in Chrome again. I’ve already done that before for mobile phones and is not a new technique to me.